Homelab Kubernetes, Part 5: Locked Down, and Wired to Tell Me
This is part 5 of a series on building a homelab Kubernetes cluster. Part 1: One Box, Real DNS covers the first node. Part 2: A GPU Node That Comes and Goes covers the second. Part 3: Real DNS Names, Real Certificates covers the domain and TLS. Part 4: Self-Sufficiency, Not Self-Signed covers the private registry.
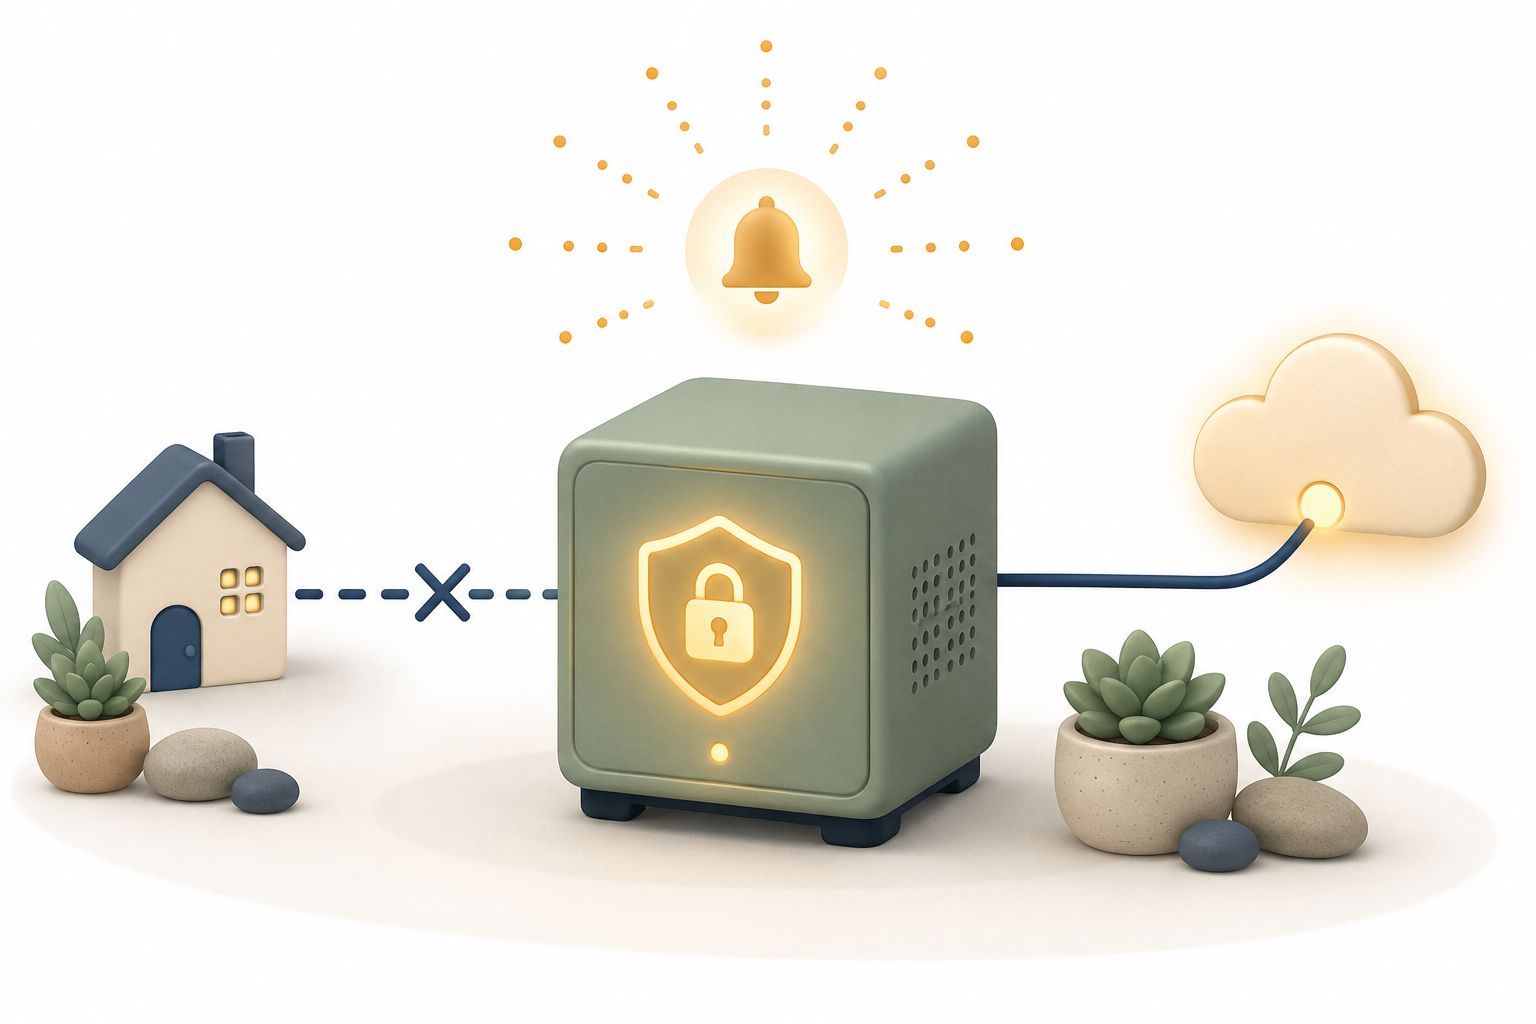
Everything in this cluster so far has been reachable from the LAN at most, behind Istio, behind OPNsense, behind a real certificate but never behind an open port on the internet. That changed with migrating an old webhook receiver off a Raspberry Pi: a small app that takes POST requests from the public internet by design, so an external service can deliver event data without an interactive login. It reaches the cluster through a Cloudflare Tunnel, no inbound port ever opened, but the endpoint itself is unauthenticated on purpose. That one pod is a genuinely different kind of citizen than anything else running here, and it changes the question worth asking about the rest of the cluster too: not "is this configured correctly," but "if this specific pod got popped, what's the actual worst case."
The answer has to be a real one, not a hope
The honest starting answer was worse than it should have been. No NetworkPolicy existed anywhere in the cluster, for anything. Kubernetes' and Cilium's default is allow-all egress, so a compromised process in that pod, today, could reach the LAN, every other pod, even the Kubernetes API server. The endpoint's own logic isn't the realistic path in either, it just writes a request body to a file, nothing executable about that. The realistic path is a dependency vulnerability somewhere in the stack underneath it, which is not hypothetical: swapping that app onto a shared library I maintain surfaced three real, transitive ws CVEs in the process, fixed with a routine npm audit fix. That's the actual shape of the risk. Not the code someone can see, the code nobody's looking at.
Cilium already runs as this cluster's CNI, which means the fix doesn't need new infrastructure, just a CiliumNetworkPolicy: deny egress to every RFC1918 private range, which covers the LAN, the pod network, and the service network all in one shot since all three sit inside 10.0.0.0/8, with one narrow exception for DNS so the tunnel sidecar can still resolve Cloudflare's own hostnames. Everything else, the actual public internet, stays open, since that's what the tunnel needs to function at all.
One nuance mattered more than expected: the app container and its tunnel sidecar share a single pod network namespace, that's literally how the sidecar reaches the app over localhost. A network policy can't be scoped differently to two containers sharing one identity, whatever applies, applies to both. Not a real gap here, since the app itself never makes an outbound call of its own, but worth knowing before assuming a policy protects only the container you had in mind.
Verified from inside the actual pod, not just inferred from the YAML: a request to the LAN times out cleanly, a real HTTPS round trip to Cloudflare's API completes, and the tunnel and a real webhook POST through the public hostname both kept working the entire time.
The same question, asked of everything else already running
Locking down one pod's network reach doesn't mean much if that same pod is still running as root with every Linux capability intact. The honest audit here wasn't much better: no securityContext anywhere, no dropped capabilities, no resource limits, meaning a compromised or just misbehaving container could also consume unbounded CPU or memory on the node running the DNS server, the workflow engine, everything else that happens to share it.
The fix is the same everywhere: non-root, every capability dropped, no privilege escalation, read-only root filesystem, real CPU and memory requests and limits. Applying it uniformly across every deployment surfaced two things worth knowing rather than guessing at:
CoreDNS binds to port 53, which is privileged on Linux, below 1024, and requires either root or the specific CAP_NET_BIND_SERVICE capability. Dropping every capability blindly would have broken DNS resolution for the entire LAN the moment that change rolled out. The fix is one line, add that capability back explicitly after dropping the rest, but it's exactly the kind of thing that looks safe in a diff and isn't.
n8n, less critically but just as real, crash-looped once on every restart under a read-only root filesystem, since it compiles static assets into a ~/.cache directory on first start that no longer existed to write to. It recovered on the retry, which is the kind of "working but crashing every time" state that's easy to leave alone because the symptom looks harmless. A small writable volume for that one path fixed it outright.
Neither of these would have shown up from reading the manifests. Both only showed up from actually watching the pods restart and reading what they logged on the way up.
A policy that fails silently is only half a control
The network lockdown from the first section works, confirmed from inside the pod, but confirming it once by hand isn't the same as knowing about it if it's ever actually tested for real. A CiliumNetworkPolicy denies traffic quietly by design. Nothing about a dropped packet tells anyone it happened.
Cilium already ships the answer to this, it's just not on by default: Hubble, the same CNI's own flow-observability layer, with a specific metric for exactly this, a counter of dropped packets labeled by the reason they were dropped, including whether a network policy was the reason. Turning it on wired that metric into a Prometheus instance built for this cluster specifically (kube-prometheus-stack, the standard way to run this stack on Kubernetes, not something worth hand-rolling from individual exporters), with one alert rule watching it: any nonzero rate of a policy-denied drop, anywhere, fires immediately. Not after a sustained trend, the way a normal availability alert would wait. A blocked connection attempt from a pod that has no legitimate reason to make one should never happen at all in normal operation, so there's no trend to wait for.
An alert that's never been tested isn't a real alert yet
An alerting rule with nowhere to send its output is just a metric with extra steps. The receiving end here is real mail infrastructure this homelab already runs itself, not a third-party relay service standing in the middle, which matters mostly for not wanting to hand a security alert's delivery path to somebody else's business decisions. The specifics of that infrastructure aren't really the story here, only that it exists and that it's mine.
What mattered more was proving the whole path end to end rather than trusting that "applied successfully" meant "will actually notify me." Alertmanager's config rejected itself once first, in a way worth remembering: the chart ships a default sub-route for its own built-in heartbeat alert, pointed at a receiver literally named null, and replacing the receiver list wholesale without keeping that pairing broke the entire config with an error about an undefined receiver, not just the new part. Once fixed, a manual test alert went in through Alertmanager's API and came out the other side as a real email, checked by logging into a second mailbox over IMAP from a completely separate machine, no shell access to anything involved. That second step mattered on purpose: it's the same way this will get checked going forward, since standing shell access to that mail infrastructure was never going to be a permanent arrangement either.
The default alerting rules were built for a cluster this isn't
The first batch of real emails after wiring the receiver was a wall of them, and almost none of it meant anything. The bundled alerting rules that ship with kube-prometheus-stack assume a highly available cluster: multiple control-plane replicas, an odd-numbered etcd quorum, redundant everything. This is one node acting as control plane, plus a second node that's a repurposed gaming PC, turned on and off on purpose, often. Against that assumption, alerts like an unreachable node, an insufficient etcd quorum, or an unreachable scheduler instance aren't occasional, they're the resting state, permanently semi-critical by a definition that was never describing this cluster in the first place.
The honest fix wasn't to tune two dozen thresholds one at a time, it was to turn the entire bundle off in one setting and keep only the one alert actually built for this cluster's real threat model, the policy-denied drop from Hubble. Raw metrics collection and every dashboard built on top of it are untouched, only the derived alerting rules stop firing. What's left afterward is small on purpose: an inbox that stays quiet unless something a pod isn't supposed to do actually happens, which is the only thing worth being paged for at all.
What this adds up to
The webhook receiver that started this is locked to internet-only egress, verified from inside the pod, not assumed from the YAML. Every other deployment in the cluster runs the same least-privilege baseline now, non-root, no spare capabilities, real resource limits, found and fixed the two places that baseline would have quietly broken something first. And the alerting behind all of it has actually been tested, not just deployed, an alert that's never been proven to arrive is really only a hope wearing a Prometheus label. What's watching now is small and specific instead of loud and generic, which is the whole point: an inbox that only speaks up when something worth hearing about actually happens.